Dashboard
|
Navigation: The User Interface > What is in Simplicity > Toolbar > Dashboard |
·This feature which will display the statistics of your business through a graphic interface on the workstation's default internet browser.
·Data security must be set up for users that are to view this information.
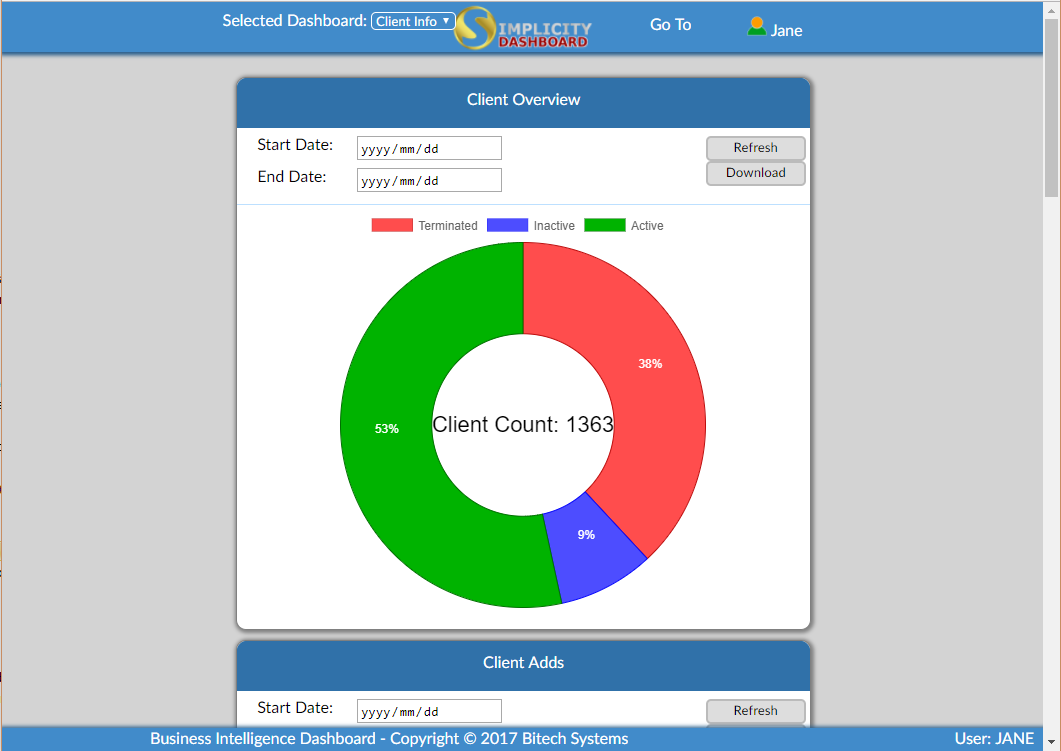
This is an example of Dashboard.
 The following can be found on the dashboard:
|
·Selected Dashboard: oThis drop down allows the user to select the dashboard they would like to view.
·
oThis option allows the user to log in and log out of the dashboard.
·Go To: oThis drop down allows the user to select the the graph they would like to view.
·Start Date: oThis option allows the user to select the start date by which the graph will filter the information.
·End Date: oThis option allows the user to select the end date by which the graph will filter the information. ·Refresh: ·This option allows the user to refresh the graph.
·Download: oThis option allows the user to download the selected graph as a picture.
|
